What is the definition of candlesticks?
Candlestick charts are a charting technique originating from 18th-century Japan that is utilized to depict the price fluctuations of an asset. The practice of identifying patterns to gain insight into what future direction asset prices may take has been utilized for centuries. Candlestick charts are presently utilized by cryptocurrency traders to examine past price data. Future price movements are predicted.
The contribution of each individual candlestick is what forms the candlestick patterns. The patterns can provide an indication of possible price increases, decreases, or stability. Valuable insights into market sentiment and potential trading opportunities can be identified by traders through pattern analysis.
Exploring the Meaning of Candlestick Charts
Picture yourself keeping tabs on the cost of an item, like stock or digital currency, throughout a specific period of time. A week, day, or hour could make up this period of time. Using a candlestick chart is a visual way to represent this price data.
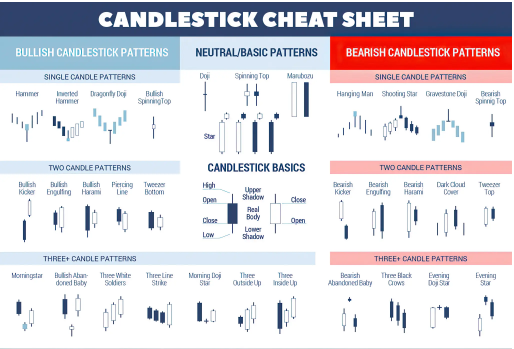
Wicks or shadows, known as two lines and a body, are typical for a candlestick. The candlestick’s body represents the range between opening and closing prices during that period. The wicks or shadows signify the highest and lowest prices achieved during that period.
The price has risen during this period if the body is green. In contrast, a red-bodied candlestick suggests bearish market conditions and implies that the price declined during that time.
Understanding the Interpretation of Candlestick Patterns
Arranging multiple candles in a specific sequence forms candlestick patterns. Numerous candlestick patterns exist, and each has its interpretation. However, some candlestick patterns offer an understanding of the equilibrium between purchasers and vendors. A reversal, continuation, or indecision might be suggested by others.
Candlestick patterns should not be regarded as having inherent signals to buy or sell. They aim not to recognize opportunities directly but to examine present market trends that could reveal potential chances. Hence, examining patterns within context is consistently advantageous.
Regarding the broader market environment or technical pattern on a chart, such as Wyckoff Method, Elliott Wave Theory, and Dow Theory, this can be considered as context. Trend Lines, Relative Strength Index (RSI), Stochastic RSI, Ichimoku Clouds, or the Parabolic SAR can also be featured as technical analysis (TA) indicators. Market indicators can aid traders in recognizing potential signals to buy or sell.
Candlestick patterns can be paired with support and resistance levels too. Levels at which strong demand is anticipated are referred to as support levels. Price levels with strong expected supply are considered resistance levels.
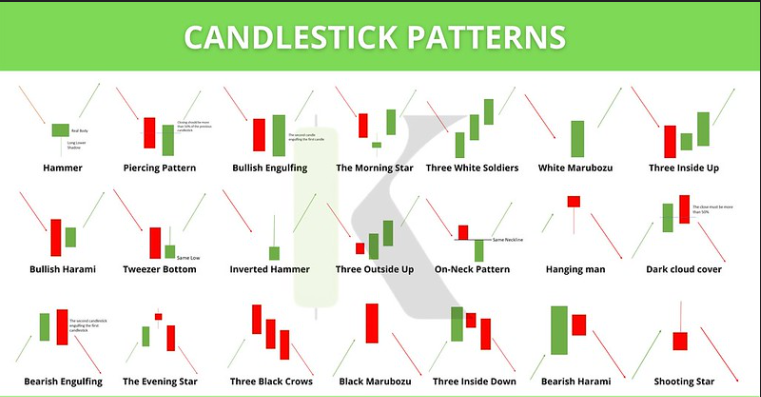
Identifying Bullish Candlestick Patterns
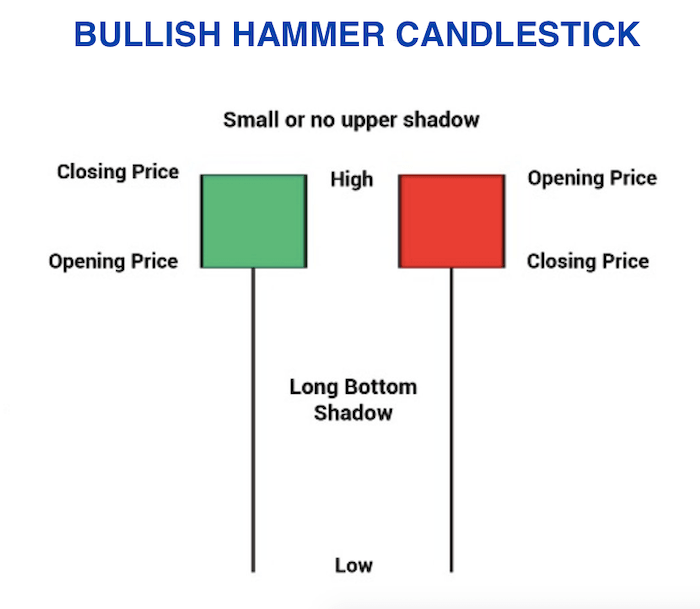
Hammer
Referred to as a ‘hammer,’ this type of candlestick has an extended lower wick located at the bottom during downtrends. The lower wick measures at minimum twice as long as the body.
A hammer was instrumental in bringing the price up near the opening despite high selling pressure from bears. Red or green hammers might indicate bullish enthusiasm, with the possibility that green hammers have the strongest indication.
Inverted hammer
This pattern is just like a hammer, except that it boasts a lengthy wick above the body as opposed to below. The upper wick should be twice as large as the body, akin to a hammer.
An inverted hammer at the bottom of a downtrend might indicate a potential to the upside. As suggested by the upper wick, the price has ceased its persistent decline despite the sellers succeeding in pushing it down near the opening at last. Buyers might assume control of the market soon, as suggested by the inverted hammer.
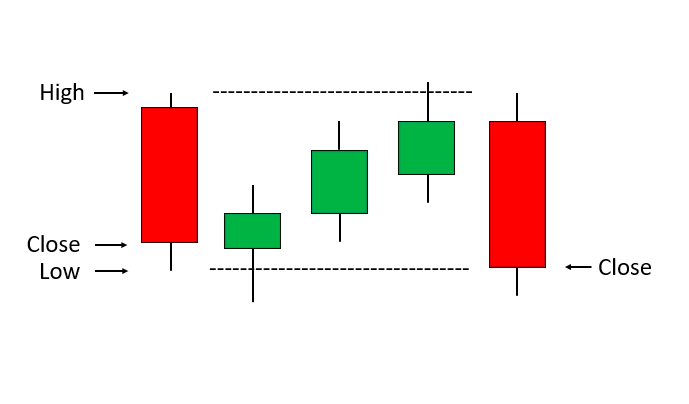
Three white soldiers
Three consecutive green candlesticks opening within the prior candle’s body form the pattern known as three white soldiers. The previous candle’s high is being surpassed by its closing price.
These candlesticks should not contain lengthy lower wicks, which are indicative of continuous buying pressure pushing up the price. By examining the size of candlesticks and the length of wicks, one can determine chances for a continuation. A potential retracement can also be inferred from this.

Bullish harami
The presence of a smaller green candlestick after a lengthy red one is indicative of a bullish harami. The previous candlestick houses completely hold the smaller green candlestick inside them.
The bearish harami formation can occur across two or more trading sessions. The pattern shows that the momentum in sales is decreasing and could be reaching its conclusion.
Bearish Candlestick Patterns
Hanging man
The hanging man is considered bearish, just like the hammer is bullish. A long lower wick and a small body at the end of an uptrend is typically its form.
The lower wick suggests a substantial sell-off. The price was elevated as control shifted back to the bulls. Given this, the drop post an extended surge could function as an ominous sign. The market’s momentum might soon go against the bulls.
Shooting star
The shooting star includes a small body and a candlestick with a long top wick and little to no bottom wick. Being situated near the bottom would be ideal. The shooting star resembles the inverted hammer in shape, but it is formed towards the end of an uptrend.
Although the market achieved a high, ultimately, the sellers took over and dropped the price again. A number of traders prefer waiting to confirm the pattern by unfolding the next few candlesticks.
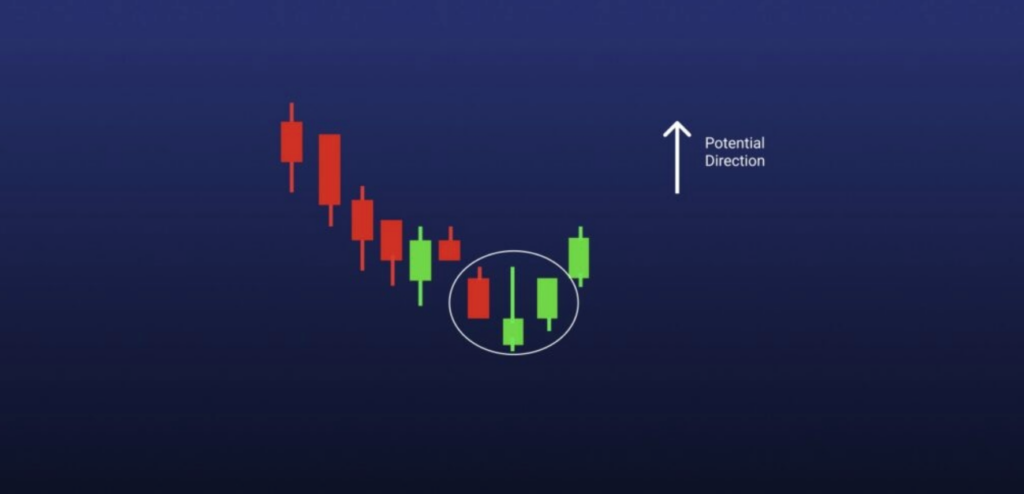
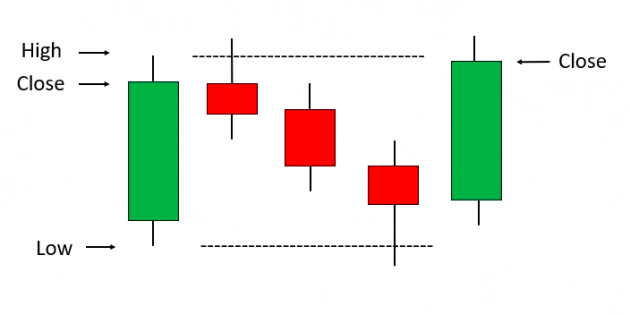
Three black crows
To form a pattern known as the Three Black Crows, there must be three consecutive red candles opening inside the prior candlesticks’ body. They are wrapping up beneath the previous candle’s low.
Three black crows represent the opposite of the bullish three white soldiers in technical analysis. An ideal situation would entail candlesticks without lengthy upper wicks, suggesting that the selling pressure has kept the price moving downwards. The probability of continuation can be assessed by analyzing the size of the candlesticks and the length of the wicks.
Bearish harami
When we observe a pattern in which a small red candlestick completely encloses the previous green one’s body and appears before a long green candlestick, it indicates the formation of bearish harami.
The bearish harami might develop towards the end of an uptrend spanning across two or more days. Buying pressure might be decreasing.
Dark cloud cover
A red candlestick that opens above the close of the previous green candlestick is what constitutes the dark cloud cover pattern. Yet, it eventually closes below the middle point of that specific candlestick.
Indicating that momentum may turn from bullish to bearish, high volume can often accompany this pattern. Waiting for a third red bar can help traders confirm the pattern.
Exploring Three Continuation Candlestick Patterns
Rising three methods
The rising three methods candlestick pattern manifests in an uptrend. Three consecutive red candlesticks with small bodies indicate that the uptrend will continue. The red candles should avoid breaking the area of the previous candlestick ideally.
A green candle with a large body confirms the continuation. This shows that the bulls have regained control of the trend’s direction.
Falling three methods
A downtrend can be confirmed with the use of the three falling methods, unlike the three rising methods that imply a bullish trend.
Doji
A Doji is created when the open and close are identical or almost identical. Although there may be fluctuations in the cost initially, ultimately, it will settle near the opening price. Therefore, a doji may suggest a moment of uncertainty between buying and selling powers. A dojo’s interpretation is greatly influenced by its context.
The following can describe a doji depending on where the open and close line falls:
Gravestone Doji
A bearish reversal candlestick pattern is forming, as evidenced by the long upper wick and open/close near the low.
Long-legged Doji
With both top and bottom wicks, the candlestick looks indecisive, with the open and close near the midpoint.
Dragonfly Doji
The candlestick can show either bullish or bearish sentiment and has a long lower wick. The high is near the open/close.
For doji to meet their original definition, both open and close must be identical. What occurs if the open and close prices aren’t identical but are nearly equivalent? The term for that is a spinning top. An exact doji is rare because cryptocurrency markets can be very volatile. It’s common to use the terms doji and spinning top interchangeably.
Advantages of Utilizing Candlestick Patterns
Candlestick patterns provide additional understanding to cryptocurrency traders regarding potential market movements. By acting as signals, they aid traders in determining when to open long or short positions. Traders are aided in deciding the appropriate time to enter or exit the market. Swing traders depend on candlestick charts for swing trading signals to identify reversal and continuation trading patterns as an illustration.
By examining the patterns in candlestick charts, traders can ascertain trends, gauge momentum, and perceive the present market sentiment instantly.
Effective Techniques for Rapidly Memorizing Candlestick Patterns
To recognize candlestick patterns quickly, traders need to gain comprehension by watching charts. The trader ought to also engage in trading using minimal funds. To commence with precision, you can emphasize one individual candle formation and break down the candle for two-stick patterns.
The ideal approach is to commence with a pattern and master it till you are confident. During price fluctuations, this can be spotted with ease.
Conclusion
Include candlestick patterns in your arsenal as a cryptocurrency trader. They exhibit equivalent efficiency to that in the forex or stock markets. We suggest merging these patterns with technical analysis indicators, although they may offer important individual trading signals. This will support in either affirming or denying them.
FAQ:
Is it possible to utilize candlestick patterns for anticipating shifts in the market?
Indeed, certain candlestick patterns possess the capability to identify trend reversals, making them distinctively recognizable by artificial intelligence. Nevertheless, it is important to note that they do not guarantee unfailing success at all times.
Does a candlestick chart possess distinctions when compared to a bar chart?
Certainly, the candlestick chart and the bar chart exhibit some resemblances as they both present an equal amount of price data. However, the candlestick chart is distinct from the bar chart and is generally regarded as being easier to interpret by most traders.
Using Candlestick Patterns Like a Pro
To understand how to read candlesticks in cryptocurrency trading, it’s essential to grasp the basics of candlestick patterns. Candlestick charts provide valuable information about price movements and can help identify trends and potential trading opportunities. Here are the key elements to consider:
- Candlestick Patterns: Candlestick patterns are formed by the arrangement of individual candlesticks on the chart. They can indicate trend reversals, trend continuations, or indecision in the market.
- Candlestick Components: Each candlestick consists of a body and wicks (also known as shadows). The body represents the price range between the opening and closing prices, while the wicks show the high and low prices during the candlestick’s time period.
- Bullish and Bearish Candlesticks: Bullish candlesticks typically have a larger body at the top, indicating higher closing prices compared to opening prices. Bearish candlesticks, on the other hand, have a larger body at the bottom, suggesting lower closing prices.
- Doji Candlestick: The doji candlestick is a specific pattern characterized by a small or nonexistent body. It indicates indecision between buyers and sellers, where the opening and closing prices are very close or virtually the same.
- Variations of Doji: Doji candlesticks can have different shapes and formations, including long-legged doji, gravestone doji, dragonfly doji, and more. Each variation provides additional insights into market sentiment and potential price reversals.
- Chart Patterns: In addition to candlestick patterns, it’s crucial to understand chart patterns like trends, support and resistance levels, and wedges. These patterns provide a broader context for interpreting candlestick formations.
By combining candlestick patterns, chart patterns, and other technical analysis tools, traders can gain a deeper understanding of market dynamics and make more informed trading decisions in the cryptocurrency market.