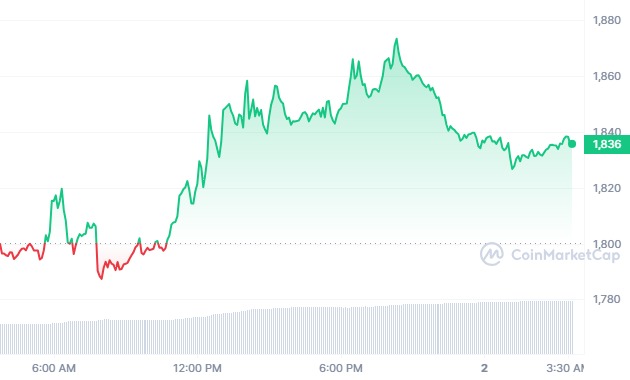
Ethereum’s price has remarkably recovered on its daily chart, surging 17.8% from its local support at $15.25 to its current trading price of $1,835. However, this upward momentum is facing resistance around the $1,850 level, reflecting the supply pressure seen in the broader cryptocurrency market, particularly Bitcoin.

However, Ethereum (ETH) has demonstrated a substantial rebound in its daily chart recently, offering hope for further gains. On Monday, Ethereum saw a total of 4,751 ETH, equivalent to around $8,551,772, burned from its transactions. This burning process involves sending tokens to an unusable wallet, effectively reducing the circulating supply of ETH.
This phenomenon was initiated with the EIP-1159 upgrade, which introduced a variable base fee for each Ethereum transaction, adjusting according to the demand for block space. The base fee is permanently removed from circulation, contributing to a decrease in the overall supply of ETH.
Currently, Ethereum is issuing new ETH at a rate of 4% per year, but experts expect it to decrease to a range of 0.5% to 1%. If the burn rate outpaces the issuance rate, Ethereum could transition into a deflationary currency.
Ethereum Price Analysis
According to Coincodex’s current ETH price predictions, the price of ETH is projected to rise by 6.14% and reach $1,919.54 by November 5, 2023. Technical indicators currently show a neutral sentiment, with the Fear & Greed Index at 72 (indicating greed). Ethereum has experienced 18 out of 30 (60%) green days with 5.43% price volatility over the last month.
Moreover, technical analysis suggests that Ethereum’s 200-day Simple Moving Average (SMA) will decrease to $1,752.27 by the end of November 2023, while the short-term 50-day SMA is expected to reach $1,854.87 by the same date.

The Relative Strength Index (RSI), a widely used momentum indicator, currently stands at 76.29. It indicates that the ETH market is in an overbought position, suggesting potential price increases.
Ethereum faces significant resistance at the $1,850 level, aligned with the upper trendline of a bullish flag pattern. With Bitcoin’s consolidation causing uncertainty, ETH has been trading sideways for over a week.
A clear breakout from the current price level will provide a more precise outlook for ETH’s short-term price action. An increase in supply pressure could lead to a drop below $1,750, potentially triggering a significant correction or keeping Ethereum within its current flag pattern.

If Ethereum can’t break the $1,850 resistance, it may dip with support at $1,800, the 100-hourly SMA, and the trendline. Furthermore, the next support levels are around $1,770, with major support forming at $1,750 and $1,740. A drop below these levels could initiate a bearish trend, potentially pushing ETH toward $1,650.
Despite current market uncertainties, ETH’s price is adhering to a flag pattern formation, with multiple rebounds within the trendline. In addition, this pattern typically signals a bullish continuation. It could motivate buyers to break above the overhead trendline, potentially propelling ETH to a target level of $2,292.
Related Reading | Ethereum’s Dynamic Duo: Security and Scalability in a Connected Ecosystem


