
On October 23, Bitcoin (BTC) surprised market participants by surging above the resistance zone, ranging from $31,000 to $32,400. Usually, the price tends to stabilize or show reluctance when it reaches strong resistance levels, but this time, the situation was different. Market participants are optimistic, expecting a Bitcoin spot exchange-traded fund (ETF) to get approved this year.
On Oct. 23, ETF analyst Eric Balchunas noted in a post on X that listing BlackRock’s Spot Bitcoin ETF on the Depository Trust and Clearing Corporation (DTCC) was a necessary step in the process of bringing the ETF to market. However, a DTCC representative later clarified that the listing ETF has been there since August, and its existence does not show any signal for approval.
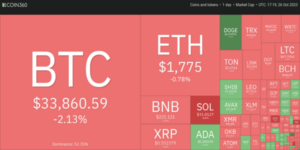
Investors are buying Bitcoin in the hope that it’ll grow in price once a Bitcoin ETF gets approved. Galaxy Digital research associate Charles Yu stated the price of Bitcoin could potentially surge by 74.1% within the first year following the launch of a United States-based ETF.
Is the recent Bitcoin rally the start of a lasting upward trend, or is it a good time to take profits? What can we expect from altcoins as Bitcoin gains strength?
Let’s examine the charts of the top 6 cryptocurrencies for insights.
Bitcoin Price Analysis
Bitcoin rose above strong resistance levels between $31,000 and $32,400 on October 23, signaling a continuation of the upward trend.
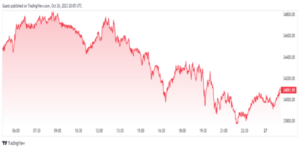
The recent strong rally has pushed the relative strength index (RSI) into the overbought region. In the early phases of a new bullish trend, the RSI usually remains in the overbought zone for an extended period. Keep an eye on $32,400 and $31,000 as important support levels. Buyers are likely to defend this zone strongly. If the price rises from this support zone, the bulls will try to push the BTC/USDT pair to $40,000. Conversely, a drop below $31,000 indicates that the recent breakout was a bull trap.
Peter Brandt’s Call
Peter Brandt, a well-known crypto analyst, expressed his belief on Twitter that BTC has hit its lowest point. Brandt predicts that we might have to wait until the third quarter of 2024 to see new all-time highs (ATHs). He also suggests Bitcoin could experience a two-year consolidation phase or sideways movement.
Anyone who declares they know the future path of any market is a fool. Markets will ALWAYS surprise.
Yet, with this disclaimer, I believe:
1. The $BTC bottom is in
2. New ATHs not coming until Q3 2024
3. Chop fest in the meanwhileI've used this blueprint for approx 2 years pic.twitter.com/hVt0zbTOsm
— Peter Brandt (@PeterLBrandt) October 25, 2023
Brandt isn’t the sole optimist. Crypto analyst Kevin Svenson highlights a historical pattern where the most favorable BTC purchase moments often occur before halving events. However, crypto fund manager Dan Tapiero has shown positive sentiments, mentioning that Bitcoin’s robust support at $25,000 may drive the cryptocurrency into a range between $35,000 and $45,000 in the near future, potentially paving the way for new all-time highs by 2024.
Ethereum Price Analysis
Ether moved above $1,746 on October 23, suggesting a possible shift in the trend’s beginning.
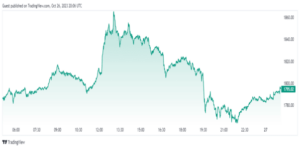
On October 24, the bulls attempted to prolong the rally, but a long wick on the candlestick indicated significant selling pressure at high price levels. The critical level to monitor on the lower side is $1,746. If bulls successfully maintain this level during the retest, the ETH/USDT pair may jump above $1,855. It will pave the way for a rally towards $1,900 and then $2,000.
BNB Price Analysis
On Oct. 23, BNB surged beyond the initial resistance level of $223. However, the bulls could not sustain their momentum and overcome the obstacle at $235.
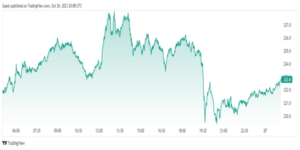
Sellers are struggling to push the price below the $223 mark. If they manage to do that, it is expected that BNB/USDT will be able to hover between $203 and $235 for a long time. If the price goes up from $223, it will indicate that the bulls are buying on dips. This increases the chance of a rally above $235, potentially reaching $250 and even $265.
Solana Price Analysis
Solana achieved the pattern target of $32.81 on Oc. 23, allowing traders to secure profits. This initiated a correction on October 24, which was short-lived.
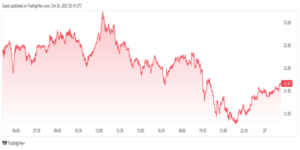
On Oct. 25, buyers drove the price above $32.81, signaling the beginning of the next upward movement. The SOL/USDT pair could potentially surge to $38.79 in the near future. However, if the price drops below $29.50, the pair may potentially plummet to $27.12.
XRP Analysis
XRP has maintained a consistent oscillation within the wide range of $0.41 to $0.56 over the past several months. On Oct. 24, the bulls successfully pushed the price above the range’s resistance. However, a long wick on the candlestick indicates the bears’ attempt to defend this level.
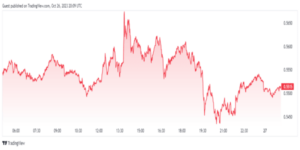
In a range, traders usually sell near the overhead resistance, and the same is seen in the XRP/USDT pair. If the price reaches the moving average, it will indicate that the pair can continue to trade in the range of $0.56 to $0.46 for several more days. Instead, if the price rises from the current level and breaks above $0.56, it will indicate the beginning of a new movement. The pair may first rise to $0.66 and then try to rally to $0.71.
Cardano Price Analysis
Cardano made a notable move above the $0.28 resistance on Oct.24. However, the extended wick on the candlestick suggests that bears are actively selling at elevated price levels.
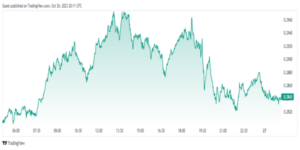
The ADA/USDT pair may witness another intense battle near the $0.28 mark. If the price slips and sustains below this level, it will indicate that the markets have refused to break out. This could keep the pair in the $0.24-$0.28 range for some time. Conversely, if the price recovers to $0.28 and rises above $0.30, it will suggest that the bulls have turned the level into support. This could start a new move to $0.32. If this level is crossed, the pair may start moving towards $0.38.


