Cardano (ADA) has demonstrated a bullish trend over the past few years. Since January, Cardano’s value has seen a 24.64% increase. This jump reflects the cryptocurrency’s solid growth momentum. As of writing, the ADA price noted an upswing of 0.47% over the past 24 hours and is currently trading at $0.5911.
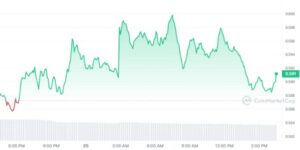
In the broader crypto market, an impressive rally is taking place. The leading cryptocurrency is now trading above $51,500. This is because the investors anticipate that the upcoming Bitcoin halving event will increase the price of BTC. Similarly, Ethereum (ETH) has surpassed the $2,900 mark. These movements have boosted other digital currencies, too. ADA firmly maintains its position among the top ten cryptocurrencies, with a market cap of $20.81 billion.
Cardano’s trading volume over the last 24 hours has surged by over 5%, reaching $403 million. This increase indicates strong interest from investors during the current upward price trends.
Technical Indicators and Future Price Movements
The recent improvement in ADA’s market performance could lead the cryptocurrency into a bullish phase. ADA’s first milestone could hit the $0.9 resistance barrier if the bulls dominate. With sustained positive momentum, the coin’s value may soon surge towards the $1 mark. However, a sustained downtrend could see ADA challenge the $0.5 support level, which could drop to $0.4 if bearish conditions intensify.
Analyzing the daily chart provides a positive view of the market. The Moving Average Convergence Divergence (MACD) indicates a bullish pattern as both the signal and MACD lines hover above the baseline. The MACD line’s being above the signal line indicates a buying opportunity. Moreover, the Chaikin Money Flow (CMF) indicator’s placement in the positive zone, at $0.22, bolsters the optimistic market view.
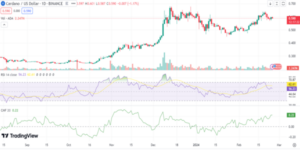
The Relative Strength Index (RSI) indicates a neutral position with a flat trend, signaling the market’s uncertainty about its direction. If the buying trend continues, ADA might become overbought soon. These indicators display that the market is at a critical point, leaning towards a bullish outcome yet awaiting further confirmation.
Analyst Says ADA Faces a Correction
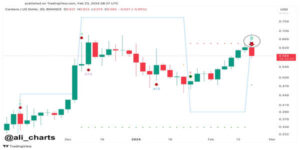
On February 23, crypto analyst Ali Martinez shared an outlook, pointing to a sell signal indicated by the TD Sequential indicator on Cardano’s 3-day chart. Technical analysts use the TD Sequential to assist traders in recognizing a potential reversal point in an asset’s market trend. According to Ali, the price of ADA has declined in the past when the indicator shows a bearish signal.
He wrote:
“The TD Sequential indicator shows a sell signal on the #Cardano 3-day chart. It’s important to note that the last two times this indicator signaled bearish, $ADA experienced a price correction!”
Here’s the chart the analyst posted:
Changelly Forecast on Cardano
According to Changelly, ADA has the potential to continue on a bullish trend year-on-year, riding on its fundamentals. The analytics firm believes ADA could retest its All-Time High (ATH) of $3.1 in June 2028. Despite its bullish stance, it expects no miraculous changes in Cardano’s price. Changelly suggests that in March this year, the lowest price might be $0.549, and the highest could reach $0.654. On average, Cardano’s value is anticipated to be approximately $0.602 next month.
Even though ADA’s price hasn’t been impressive, ongoing developments in the Cardano blockchain show a resilient commitment to expanding its ecosystem. Cardano’s development report mentions 157 launched projects, with 1,322 in progress.

