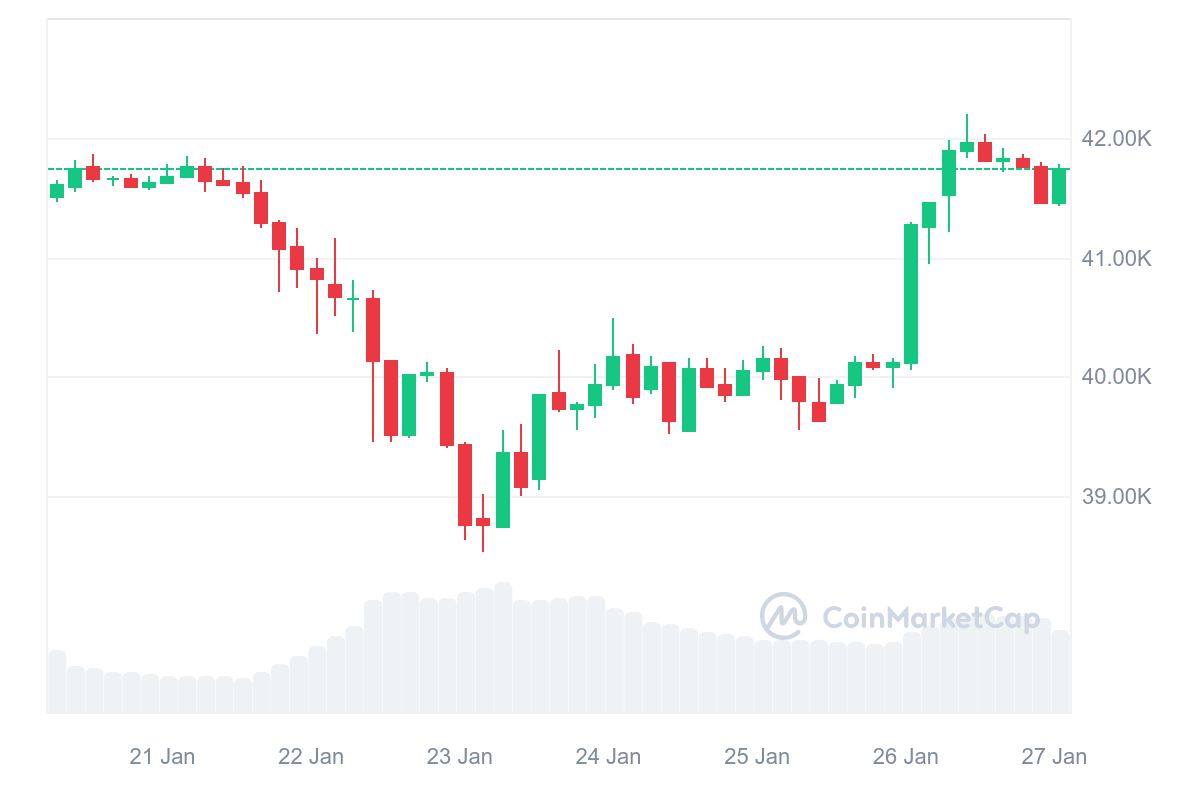
Bitcoin has broken through the $42,000 barrier, signaling a notable recovery in the cryptocurrency market following the recent spot Bitcoin exchange-traded fund (ETF)-linked sell-off. As reported by CoinMarketcap, Bitcoin exhibited a rapid ascent from $39,645 on January 26, marking a 5% gain to reach a trading price of $42,200.

Presently, the price of Bitcoin stands at $41,762, boasting a 24-hour trading volume of $35.29 billion, a market capitalization of $818.96 billion, and a market dominance of 50.47%. Over the last 24 hours, the BTC price has increased by 1.59%.
This surge in Bitcoin’s price coincides with a slowdown in outflows for Grayscale’s GBTC spot ETF, a key indicator of market sentiment. According to data from BitMEX Research, GBTC witnessed outflows amounting to $394.1 million on January 25, a decline from the $429.3 million recorded on January 24 and the $515.3 million on January 23. Although still substantial, the January 25 outflow marked the second-lowest since the initiation of spot Bitcoin ETF trading on January 11.
Bitcoin Spot ETF Flow – Day 10
Data out for all providers
$80m net outflow for day 10 pic.twitter.com/iFa1KTOk4t
— BitMEX Research (@BitMEXResearch) January 26, 2024
Bitcoin’s Technical Analysis Points to Upside Potential
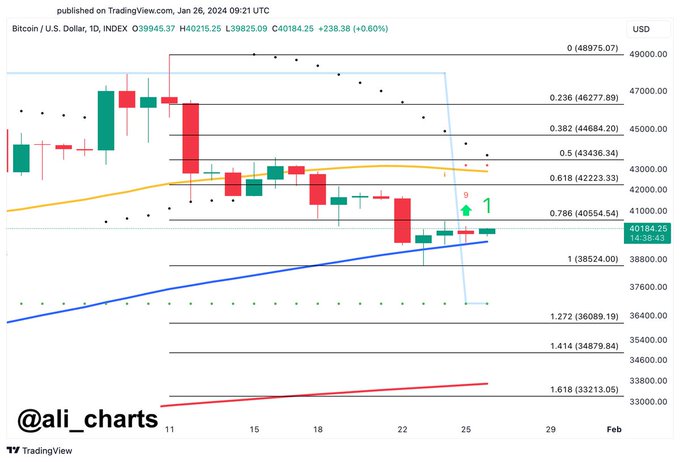
Crypto analyst Ali Martinez provided insights via X post, emphasizing that the TD Sequential flashed a buy signal on the daily chart while Bitcoin maintained its position above the 100SMA. Martinez suggested that an upward move beyond $40,550 could trigger a further upswing to $43,000.
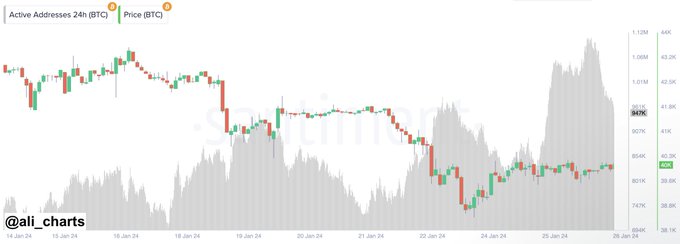
However, the analyst advised a caution, directing attention towards the 100SMA support level, as a breach could potentially lead BTC to $33,300. Martinez also highlighted a significant development in the Bitcoin network, with active BTC addresses surpassing the one million mark. The growing participation and usage of Bitcoin are viewed as positive signals, indicating a surge.
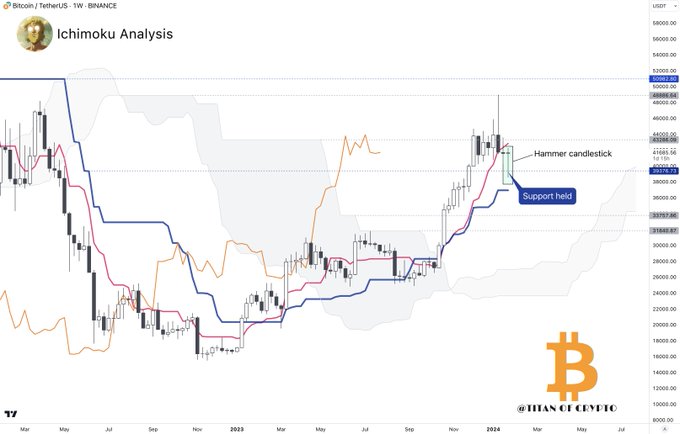
Adding to the optimistic outlook, another crypto analyst known as Titan Of Crypto pointed out a Bitcoin Bullish Hammer Candlestick formation. Following a bounce from the $39.3k support, this weekly timeframe pattern suggests potential bullish momentum. If the weekly candle closes in this manner, it could pave the way for further bullishness in the upcoming week.
Related Reading | UK Supreme Court Denies Craig Wright’s Libel Appeal


