Introduction
The RSI indicator, which measures the momentum and speed cryptocurrency price movement, holds great significance for crypto trading. Seasoned traders especially favor this indicator. By analyzing the data provided by RSI, such as that of Bitcoin, it becomes possible to determine if an asset has been overbought or oversold.
The RSI Formula Unraveled: Unveiling Its Secrets
Cryptocurrency traders highly value the RSI indicator, which analyzes price changes and movements over a 14-period time frame. This crucial tool considers the most recent 14 candles but can be adjusted to accommodate individual trading strategies. It offers various timescales, ranging from weeks to minutes, for traders to evaluate.
In financial analysis, one can use a simple formula to calculate the RSI indicator. The equation goes like this:
RSI = 100 [100/(1 + RS)]

Mastering the RSI Indicator: Unlocking its Reading Secrets
The Relative Strength Index (RSI) indicator is comprised of three lines: two straight dots at the top and bottom, along with a wavy line in the middle. Its purpose lies in determining whether trading items are overbought or oversold. This article delves into the RSI indicator and its impact on market conditions and price patterns.
The Components of the RSI Indicator
The RSI indicator is composed of three lines. At the extremes (the top and bottom), there are two straight dots, while a wavy line oscillates between these points. This wavy line represents the RSI reading, providing valuable insights into whether trading items are overbought or oversold.
Overbought and Oversold Signals
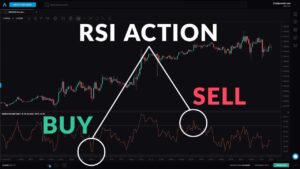
When the RSI indicator hits a value of 70 or above, the asset is said to be overbought. On the other hand, if it approaches a discount of 30 or falls below it, it suggests that the purchase is oversold. This widely accepted interpretation aids traders in spotting potential reversals in market trends.
Alternative Interpretations
Traders have the option to choose levels other than the conventional 70/30 threshold, such as 80/20 or even 85/15. Opting for these higher thresholds yields stronger signals, indicating a decreased likelihood of the market maintaining its current pace when the RSI goes beyond 80 or drops below 20.
Implications of Overbought and Oversold Conditions
The overbought or oversold status of an item doesn’t guarantee an immediate market reversal but suggests a faster-than-expected movement. Traders can make informed decisions by identifying market conditions and recognizing price patterns using the RSI indicator.
Using RSI to Identify Trends
The crossing of the RSI indicator at 50 can potentially indicate a trend in the market. When the RSI crosses above 50, it signals a positive direction, suggesting that prices are rising. On the other hand, if the indicator’s value falls below 50, it may indicate a negative trend with falling prices.

RSI Divergence Decoded: Understanding its Intricacies
An RSI divergence occurs when the price of a cryptocurrency reaches a new high or low, but the RSI doesn’t follow suit. Compared to the price graph, the indicator goes in the opposite direction. According to the RSI divergence,
- A bearish divergence, which indicates that momentum is ebbing, is produced when the RSI indicator fails to confirm the new top.
- When the cost of an asset hits a new low, but the RSI indicator doesn’t confirm it, this is an example of a bullish divergence. Investors consider now to be an excellent time to purchase.
A divergence between the price movement of an item and the RSI oscillator may indicate a trend reversal.
Mastering the RSI Indicator: A Step-by-Step Interpretation Guide
In the realm of cryptocurrency trading, it is crucial to understand the concept of overbought and oversold conditions in the Relative Strength Index (RSI). These conditions can persist for considerable durations, impacting market dynamics. During bullish phases, digital currencies like Bitcoin often find themselves lingering in the overbought region with limited relief.
Conversely, bearish markets witness a shift towards oversold levels. The RSI is a momentum oscillator that is pivotal in identifying prolonged unidirectional price movements. However, considering it solely as a warning signal becomes vital for traders. This prompts them to closely observe trends and diligently search for potential signs of overextension.
The Persistence of Overbought and Oversold Conditions
In bull markets, Bitcoin often remains in the overbought territory for extended periods. Conversely, during bear markets, the opposite trend occurs. The Relative Strength Index (RSI), a momentum oscillator, proves valuable in identifying prolonged unidirectional price trends. However, traders should exercise caution and interpret the RSI as an alert to monitor potential overextension to make informed decisions about market direction.
Understanding the Relationship Between RSI and Price Action
The correlation between the calculation, reading, and observed price movement of the RSI is pivotal. When the price fluctuates within a narrow range for a significant period, the RSI tends to become neutral. However, any sudden and substantial deviation from this established scope can be seen as an outlier, pushing the RSI to its limits. It is crucial not to interpret these readings as overbought or oversold signals in trading.
The Ideal Trading Environment for RSI
The RSI is most effective when used in a trading environment that complements its characteristics. It functions similarly to moving average indicators, which are tailored to specific trends. Notably, a drop-off in momentum at the extremes often signals anticipated reversals. In range-bound scenarios, the RSI performs optimally. However, caution should be exercised when using the RSI in strongly trending markets as it may lead to erroneous signals. Traders frequently observe divergences in the RSI during market movements.
The Meaning of Low RSI
The Relative Strength Index (RSI) serves as a valuable tool for investors interested in Bitcoin. When the RSI is low, it suggests oversold conditions for Bitcoin and other cryptocurrencies. By analyzing and understanding the RSI, individuals can effectively identify instances of oversold conditions that present excellent buying opportunities. This article explores the optimal range of RSI values for purchasing Bitcoin and provides insights into using specific RSI settings to enhance decision-making accuracy.
Identifying Oversold Conditions and Optimal Buying Opportunities
A low RSI reading suggests that Bitcoin or another cryptocurrency is oversold. This presents an opportunity for investors looking to enhance their portfolios by finding undervalued assets. It’s worth noting that, barring severe bear markets, Bitcoin rarely drops below a specific bottom level at its lowest point. Typically, the 30–40 RSI range indicates when Bitcoin reaches its peak. Consequently, RSI readings around the 30s and 40s become attractive entry points for purchasing Bitcoin, providing crucial information for those seeking optimal buying opportunities.
Anticipating Trend Reversals and Rising Momentum
When the RSI hovers between 30 and 40, it often indicates a potential trend reversal for Bitcoin. Consequently, traders and investors who are keen on taking advantage of price surges can anticipate short-term rising momentum. This particular scenario holds favorable prospects for those seeking to capitalize on market movements.
Enhancing RSI Accuracy
Traders have the opportunity to enhance the accuracy of their RSI indicator through adjustments made to the overbought and oversold settings. By setting the overbought level to 80 and the oversold level to 20, they can effectively eliminate most market noise—this refined approach in utilizing the RSI empowers traders with greater precision and better informed decision-making.
Conclusion
RSI, also known as the Relative Strength Index, holds a prominent position among crypto traders as a widely-used technical indicator. Its purpose is to gauge the velocity and magnitude of price changes in the market. By identifying instances of overbought or oversold conditions, RSI assists traders in executing well-informed decisions. To effectively leverage RSI for Bitcoin trading, it is crucial to monitor its levels diligently while actively seeking divergences. Additionally, combining RSI with other indicators can significantly enhance analysis accuracy and timing precision.
FAQs
Is RSI Trustworthy?
The RSI serves as one of the most reliable indicators for both short- and long-term trends. Its accuracy increases when it aligns with or mirrors other long-term trend patterns. Skillful traders on day/week charts utilize the RSI to analyze past price movements, and make informed assessments about the current state of the market.
What does the Bitcoin RSI mean?
One candle represents a single period in the calculation, based on the 14 most recent occurrences. The Bitcoin RSI indicator is used to identify market conditions of being overbought or oversold. When its value exceeds 70, it indicates an overbought market, while a value below 30 denotes an oversold market.
Is RSI a reliable crypto indicator?
The Relative Strength Index is a powerful indicator that can be applied to various markets, including cryptocurrency. Its simplicity makes it an excellent starting point for studying technical analysis.
What period ought I employ for RSI crypto?
The default time limit for this is 14 days. Trading has also been done over 5-day and even 50-day intervals, despite research suggesting that 14 days is more accurate.
Does the five-minute chart support the RSI?
RSI can serve as a reliable guideline after enough candles have been formed throughout the day to ensure a trustworthy signal. For those employing 5 Minute charts, observing the {14 RSI approximately one hour into the trading session is advisable. This approach will provide a reasonably dependable indication once 60 minutes have passed.
The Relative Strength Index, like other price action-derived indicators, provides immediate insights into the current market situation. It presents a smoothed representation of the ongoing price movements, making it easier to comprehend and analyze the minor elements. Understanding how this tool works is crucial as it offers strengths and limitations. However, it’s important to note that just like any other indicator, the RSI may provide inaccurate information at times. Therefore, thorough backtesting and continuous monitoring of trade performance data are recommended before relying on its signals.


