


Ethereum’s price has remarkably recovered on its daily chart, surging 17.8% from its local support at $15.25 to its current trading price of $1,835. However, this upward momentum is facing resistance around the $1,850 level, reflecting the supply pressure seen in the broader cryptocurrency market, particularly Bitcoin.
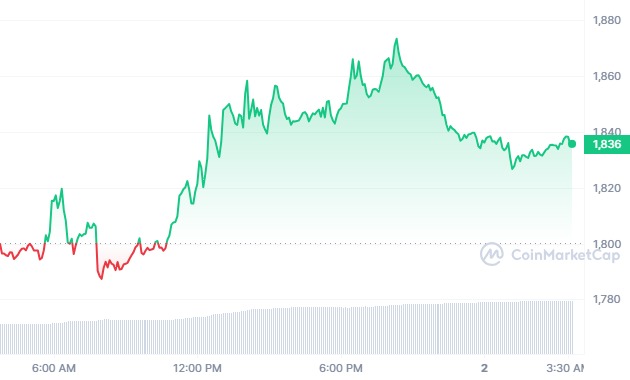
However, Ethereum (ETH) has demonstrated a substantial rebound in its daily chart recently, offering hope for further gains. On Monday, Ethereum saw a total of 4,751 ETH, equivalent to around $8,551,772, burned from its transactions. This burning process involves sending tokens to an unusable wallet, effectively reducing the circulating supply of ETH.
This phenomenon was initiated with the EIP-1159 upgrade, which introduced a variable base fee for each Ethereum transaction, adjusting according to the demand for block space. The base fee is permanently removed from circulation, contributing to a decrease in the overall supply of ETH.
Currently, Ethereum is issuing new ETH at a rate of 4% per year, but experts expect it to decrease to a range of 0.5% to 1%. If the burn rate outpaces the issuance rate, Ethereum could transition into a deflationary currency.
Ethereum Price Analysis
According to Coincodex’s current ETH price predictions, the price of ETH is projected to rise by 6.14% and reach $1,919.54 by November 5, 2023. Technical indicators currently show a neutral sentiment, with the Fear & Greed Index at 72 (indicating greed). Ethereum has experienced 18 out of 30 (60%) green days with 5.43% price volatility over the last month.
Moreover, technical analysis suggests that Ethereum’s 200-day Simple Moving Average (SMA) will decrease to $1,752.27 by the end of November 2023, while the short-term 50-day SMA is expected to reach $1,854.87 by the same date.
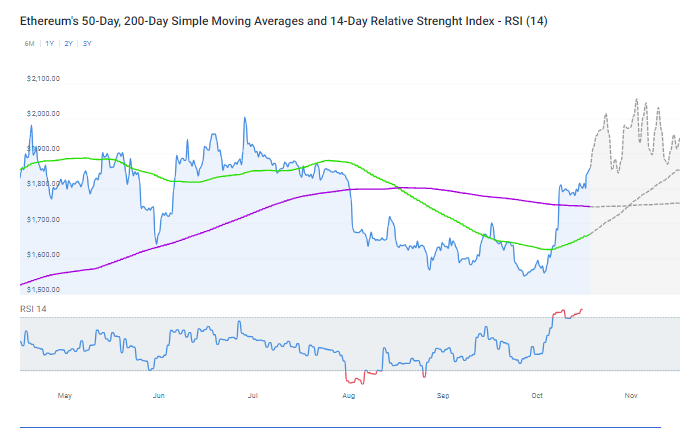
The Relative Strength Index (RSI), a widely used momentum indicator, currently stands at 76.29. It indicates that the ETH market is in an overbought position, suggesting potential price increases.
Ethereum faces significant resistance at the $1,850 level, aligned with the upper trendline of a bullish flag pattern. With Bitcoin’s consolidation causing uncertainty, ETH has been trading sideways for over a week.
A clear breakout from the current price level will provide a more precise outlook for ETH’s short-term price action. An increase in supply pressure could lead to a drop below $1,750, potentially triggering a significant correction or keeping Ethereum within its current flag pattern.

If Ethereum can’t break the $1,850 resistance, it may dip with support at $1,800, the 100-hourly SMA, and the trendline. Furthermore, the next support levels are around $1,770, with major support forming at $1,750 and $1,740. A drop below these levels could initiate a bearish trend, potentially pushing ETH toward $1,650.
Despite current market uncertainties, ETH’s price is adhering to a flag pattern formation, with multiple rebounds within the trendline. In addition, this pattern typically signals a bullish continuation. It could motivate buyers to break above the overhead trendline, potentially propelling ETH to a target level of $2,292.
Related Reading | Ethereum’s Dynamic Duo: Security and Scalability in a Connected Ecosystem

RELATED STORIES
MORE ON NEWS
Bitcoin and Altcoins Face Critical Levels: Price Analysis for BTC, ETH, XRP, BNB, SOL, DOGE, ADA, PI
The cryptocurrency market remains highly volatile, with Bitcoin struggling to hold above key support levels. Ethereum, XRP, and other major altcoins are also testing crucial price points, raising concerns among traders and investors. As recent market developments unfold, institutional moves and macroeconomic factors continue to shape the short-term outlook. Bitcoin Price Analysis (BTC/USDT) Bitcoin has […]

Bitcoin Reclaims Above $63K: Reload for New Highs or Selling Surge Ahead?
Bitcoin’s market cap increased by 7% in the last 24 hours, currently trading at $63,166.72. This bullish rally surprised many traders, and they dramatically changed their positions on Binance – from liquidated short positions to long trades catching an upswing wave. Certainly, however much optimism the surge has led to, analysts from on-chain data platform […]

VeChain (VET) Is Poised For Surge: Analysts Forecast 400-500% Bullish Rally
VeChain (VET) is attracting a lot of attention and is seen to be moving up strongly, with optimism about its future shown by analysts and investors. Currently, VeChain is priced at $0.03755, while trading volumes within 24 hours amount to $54.67 million and market capitalization hitting $2.59 billion. Over the last day, it has grown […]


RELATED STORIES
MORE ON NEWS
Bitcoin and Altcoins Face Critical Levels: Price Analysis for BTC, ETH, XRP, BNB, SOL, DOGE, ADA, PI
The cryptocurrency market remains highly volatile, with Bitcoin struggling to hold above key support levels. Ethereum, XRP, and other major altcoins are also testing crucial price points, raising concerns among traders and investors. As recent market developments unfold, institutional moves and macroeconomic factors continue to shape the short-term outlook. Bitcoin Price Analysis (BTC/USDT) Bitcoin has […]
Bitcoin Reclaims Above $63K: Reload for New Highs or Selling Surge Ahead?
Bitcoin’s market cap increased by 7% in the last 24 hours, currently trading at $63,166.72. This bullish rally surprised many traders, and they dramatically changed their positions on Binance – from liquidated short positions to long trades catching an upswing wave. Certainly, however much optimism the surge has led to, analysts from on-chain data platform […]
VeChain (VET) Is Poised For Surge: Analysts Forecast 400-500% Bullish Rally
VeChain (VET) is attracting a lot of attention and is seen to be moving up strongly, with optimism about its future shown by analysts and investors. Currently, VeChain is priced at $0.03755, while trading volumes within 24 hours amount to $54.67 million and market capitalization hitting $2.59 billion. Over the last day, it has grown […]